GPU vs CPU - Matmul, Sine Waves, and the Myth of Speed
Understanding GPU Performance - When Parallel Processing Outweighs Overhead

Overview
This post presents a detailed performance analysis comparing CPU and GPU execution for common machine learning operations. Using PyTorch on an NVIDIA A100 GPU, we’ll explore when GPUs provide actual performance benefits and when they might not be the optimal choice.
matmul operation
Matrix multiplication is one of the most common operations when it comes to training ML models or using them for inference. So let’s check out how a simple matmul operation holds up when we run it on CPU & GPU.
This is the function we are going to benchmark:
1
2
3
@timeit(repeats=5)
def matmul(x: torch.Tensor, y: torch.Tensor):
	return matmul(x, y)
There are tons of way to benchmark functions in Python but in this case we are using a custom timeit annotation which just executes the function n times and returns the average as the function output.
Let’s start getting some numbers for CPU then using the code below.
1
2
3
4
5
6
7
8
9
times_cpu = []

for i in range(16):
	print(f"Iteration: #{i}")
	dim = 2 ** i
	x = torch.rand(dim, dim)
	y = torch.rand(dim, dim)

	times_cpu.append(matmul(x, y))
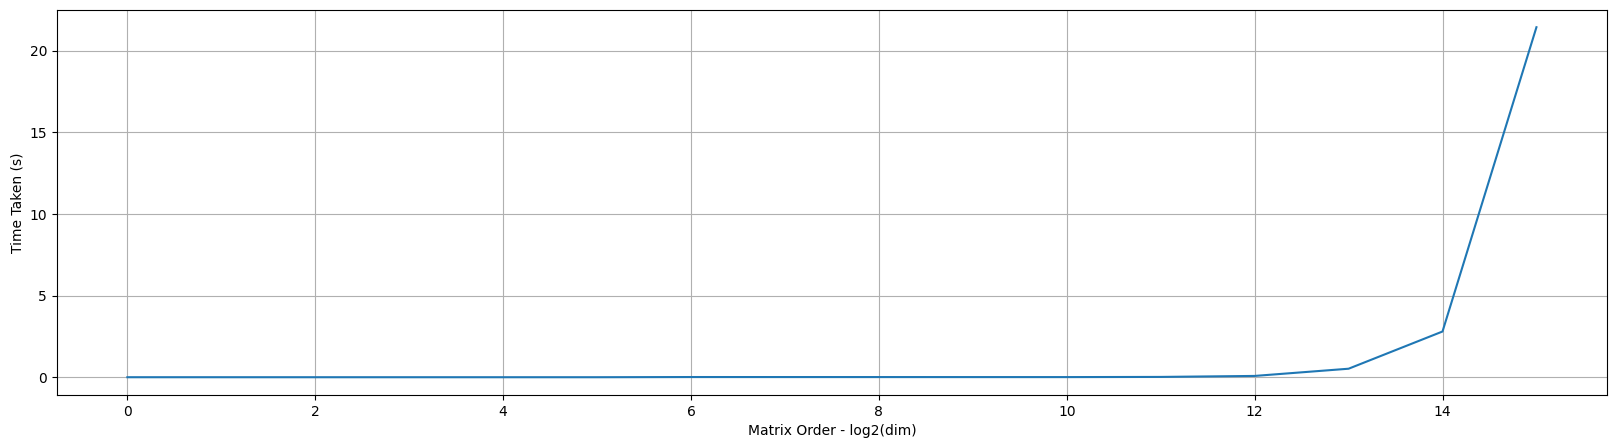
If we plot the CPU times, we see an exponential increase in the time as we increase the order of the input dimension matrix as shown below which makes sense.
matmul on GPU
Now let’s tweak our function to run the same on GPU as shown below. Essentially, we are loading the tensors to the GPU, performing matmul and returning it to CPU.
1
2
3
4
5
6
7
8
9
10
11
12
@timeit(repeats=5)
def matmul(x: torch.Tensor, y: torch.Tensor):
	return matmul(x.cuda(), y.cuda()).cpu()

times_gpu = []
for i in range(16):
	print(f"Iteration: #{i}")
	dim = 2 ** i
	x = torch.rand(dim, dim)
	y = torch.rand(dim, dim)

	times_gpu.append(matmul(x, y))
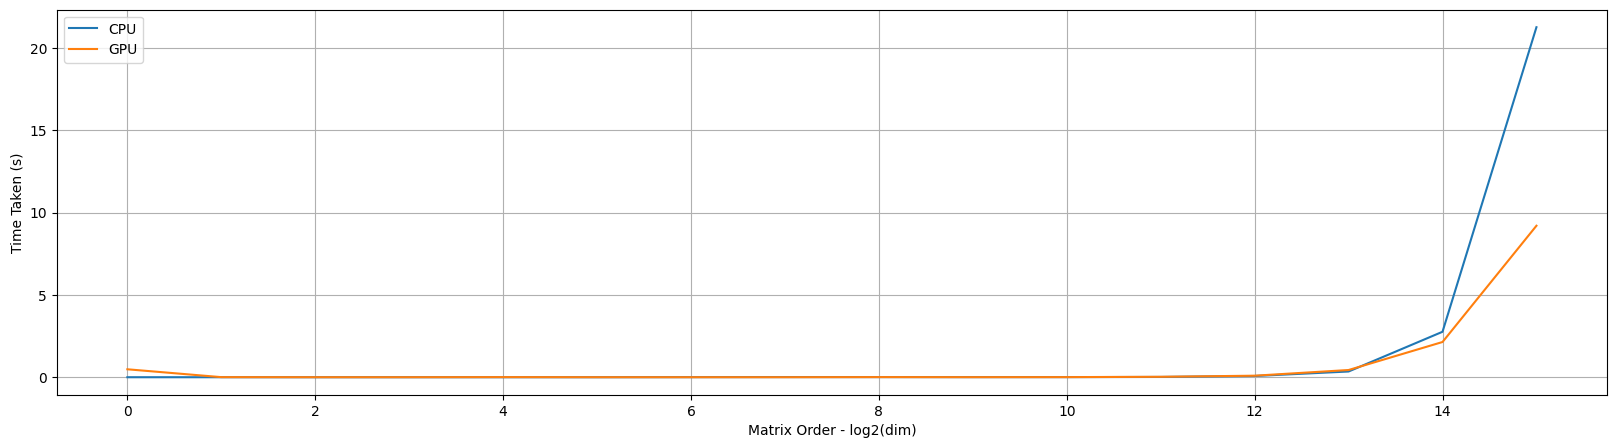
When we compare the time taken from CPU & GPU for matmul we can make a couple of observations based on the plot:
- GPU starts beating CPU only at much larger dimensions where the multiprocessing capabilities really come into play
- There is an odd bump in the start of GPU step
- This is due to the GPU kernel initialisation which is required first time to do the
matmuloperation but not required afterwards
- This is due to the GPU kernel initialisation which is required first time to do the
Note: With all the modern CPU processors, the benefit of GPUs really kicks in at larger scale only. So while optimizing if you’re scale is not that large, maybe try running it on a CPU instead.
matmul on GPU without IO
In our benchmark function, we are performing lot of IO moving the tensors back and forth between CPU & GPU. Let’s try to evaluate the raw compute performance of the GPU instead now.
1
2
3
4
5
6
7
8
9
10
11
12
@timeit(repeats=5)
def matmul(x: torch.Tensor, y: torch.Tensor):
	return matmul(x, y)

times_gpu_noio = []
for i in range(16):
	print(f"Iteration: #{i}")
	dim = 2 ** i
	x = torch.rand(dim, dim).cuda()
	y = torch.rand(dim, dim).cuda()

	times_gpu_noio.append(matmul(x, y))
When we plot and compare the times for the 3 runs so far, it looks like the GPU compute is almost constant!! Does this mean that all the work for the GPU run is going towards IO ??
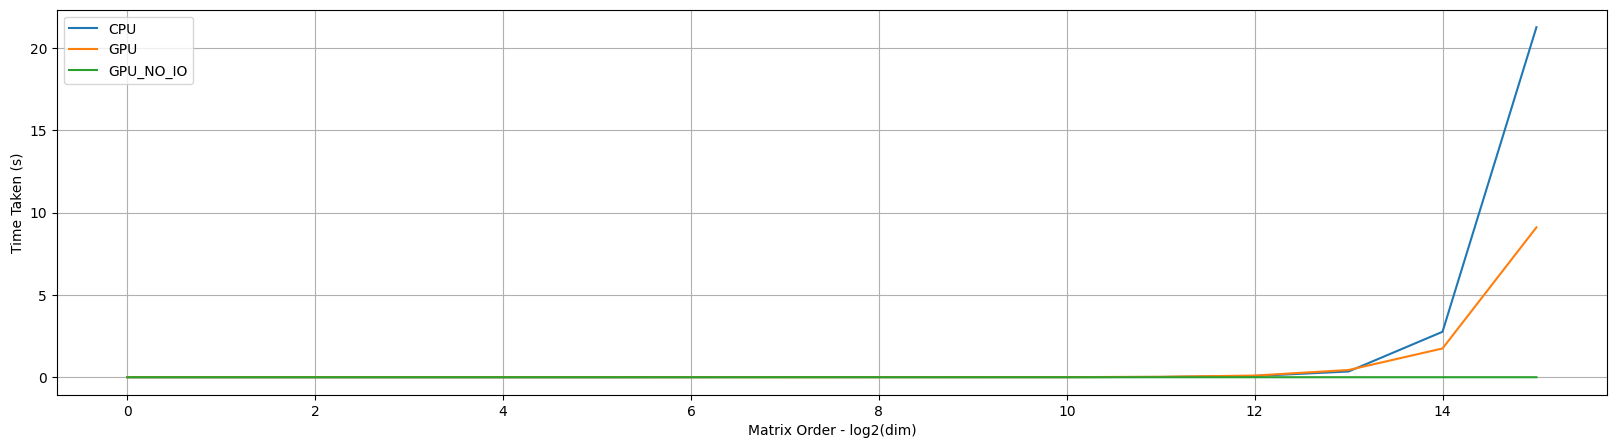
Answer is no! We have to remember that GPU is inherently async in nature and simple timer statements are not adequate to capture the actual time taken for the GPU compute. In our example we basically take a difference of the time.time() value before and after the fn is executed but the GPU may still be going operations asynchronously.
To fix this, we need to make a small tweak to our matmul function as shown below
1
2
3
4
5
@timeit(repeats=5)
def matmul(x: torch.Tensor, y: torch.Tensor):
	z = matmul(x, y)
	torch.cuda.synchronize()
	return z
Note: If we you are profiling GPU components, ensure you synchronize to get the actual time taken. Else you’re just calculating the time it takes to submit the kernel to GPU!
Now let’s rerun the experiment, plot the times and the world makes sense again!
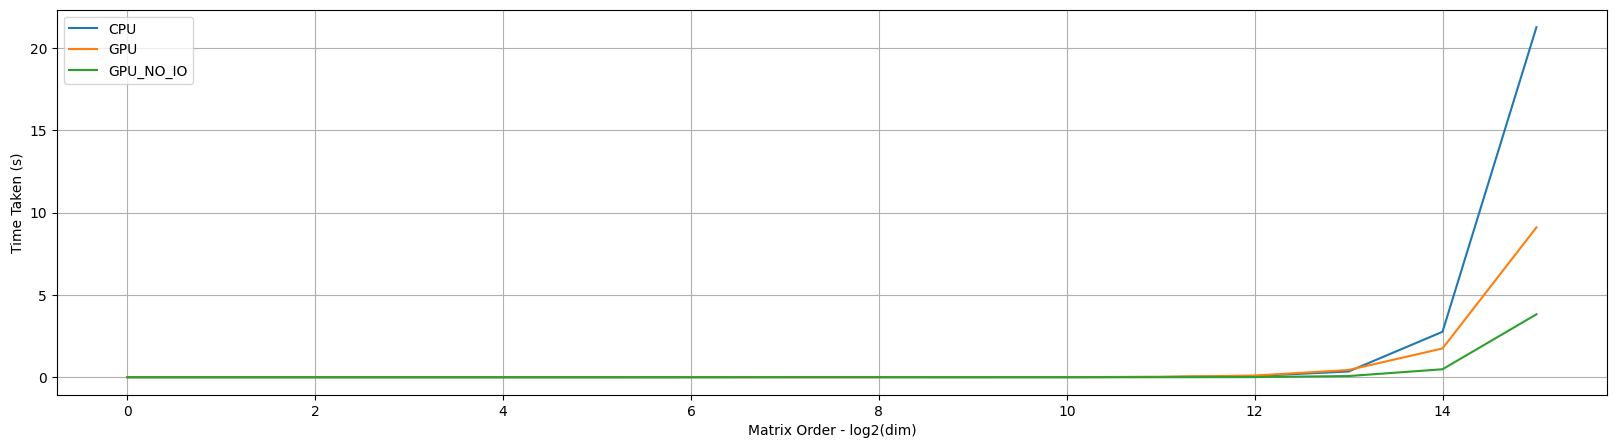
Note: If you look at the graph you’ll realize the actual compute is just 50%, the other 50% is the IO. For optimization this is very important so you’ll know if you need to make the algo faster or if you’ll memory constrained.
Nested sine operation
Let’s take a detour and explore a slightly different function which is a nested sine.
1
2
3
4
5
6
def nested_sin(x: torch.Tensor):
	x = torch.sin(x)
	x = torch.sin(x)
	x = torch.sin(x)
	x = torch.sin(x)
	return x
1
2
3
4
5
6
7
8
9
def nested_sin_gpu(x: torch.Tensor):
	x = x.to('cuda')
	x = torch.sin(x)
	x = torch.sin(x)
	x = torch.sin(x)
	x = torch.sin(x)
	torch.cuda.synchronize()
	y = x.cpu()
	return y
Note: To ensure accurate profiling and correct synchronization, you should synchronize the GPU before moving the tensor back to the CPU. This guarantees that all GPU operations are completed before you start transferring the data back to the CPU. Synchronizing after
x.cpu()is redundant becausex.cpu()will wait for all preceding operations on the GPU to complete before it starts transferring data.
Unlike matmul, sine is not very computationally intensive so let’s run the same experiment to see how this stacks up.
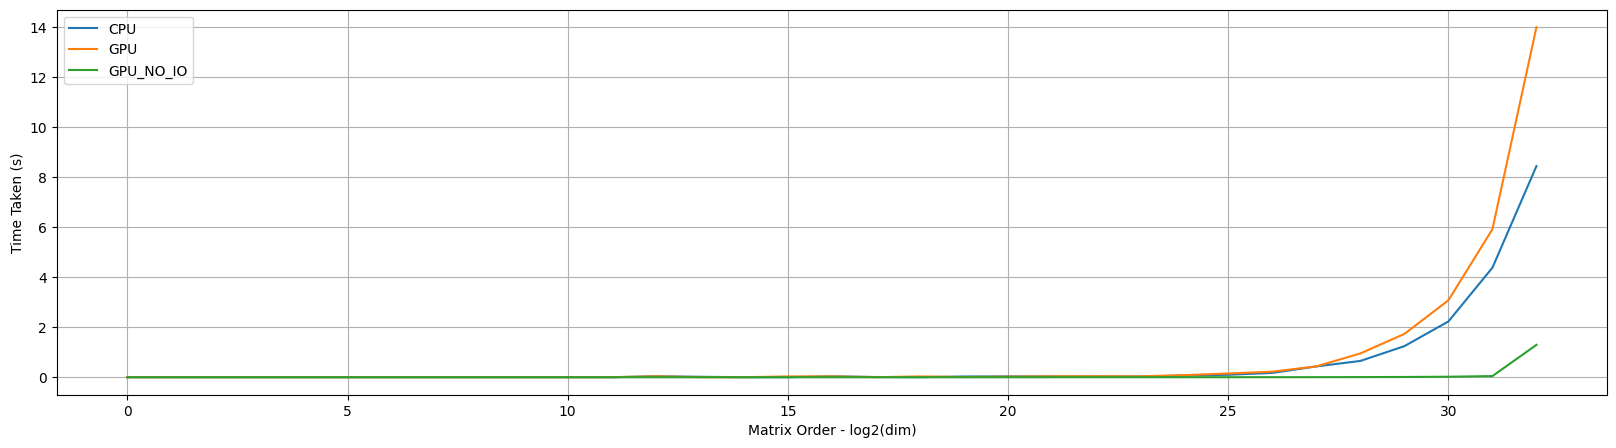
Wow, this is quite the surprise! CPU is faster than GPU at scale (for tensor of size $2^{32}$ ) but interestingly the GPU time without IO is extremely small. We can extend this and make two conclusions:
- Our
nested_sinis a pretty simple function - GPU can overcomplicate simple functions
Note: GPUs are specialized compute great at massive parallelizable tasks but the value add drops when the tasks is simple where the overheads of GPU outweigh the benefits.
Profiling nested sine IO
Let’s take a deeper look to understand where the overhead is coming from. Based on the data at hand, we suspect IO to be the culprit. So let’s get some evidence to confirm our suspicions using torch.trace.
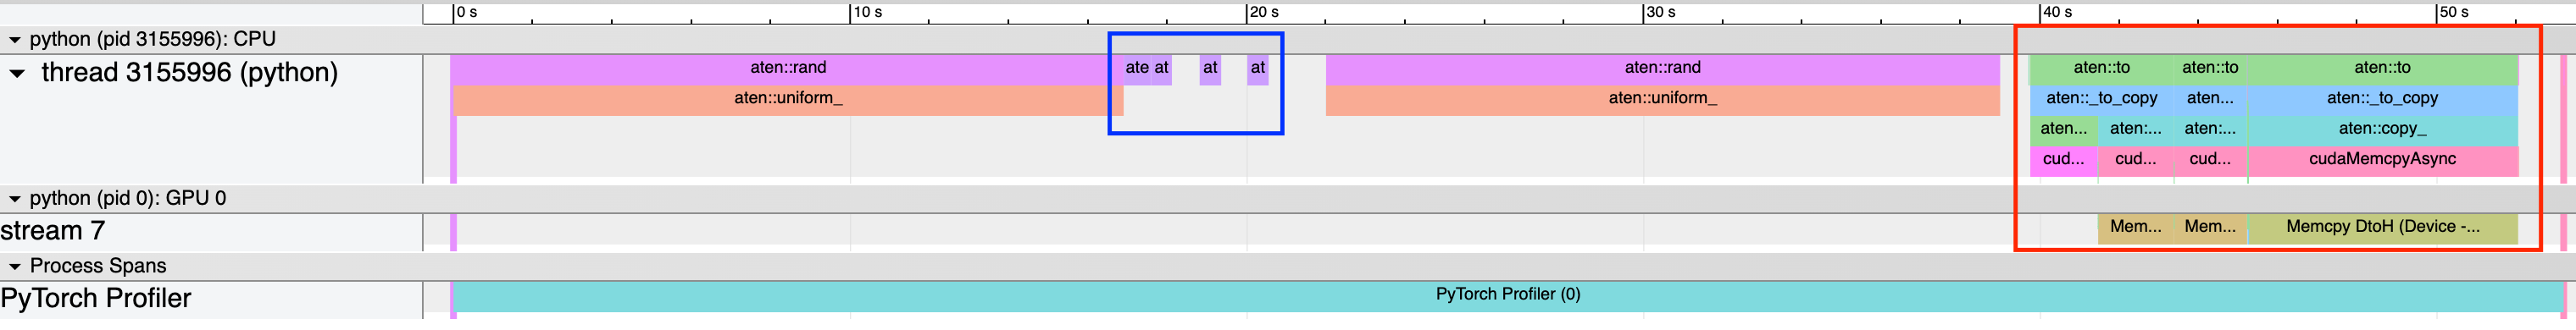
The torch trace confirms our suspicions as highlighted in the blue and red boxes:
- The blue box is the CPU compute for the nested
sinewhich is super quick. - The red box is the GPU compute
- Notice a lot of
aten::to_copyandmemcpy, these are basically the IO operations to move the input tensor to CPU & back
- Notice a lot of
- The actual kernel for
sineis super small which reinforces our statement that its a simple operation that doesnt get a lot of optimization from GPU - The large
aten::randon CPU thread is the command we use to generate a random input tensor.- This is expected to be large since its a float32 tensor (4 bytes) of size \(2^{31}\) which is about 8.5 GB!!
Note: Operations like
matmulare super common in ML so most of the GPUs are explicity optimized to handle it far more efficiently (Check out tensor cores).
Profiling nested sine kernels
Putting IO aside let’s have a look at how the GPU kernel execution happens for the nested sine against using our trust tool torch.trace
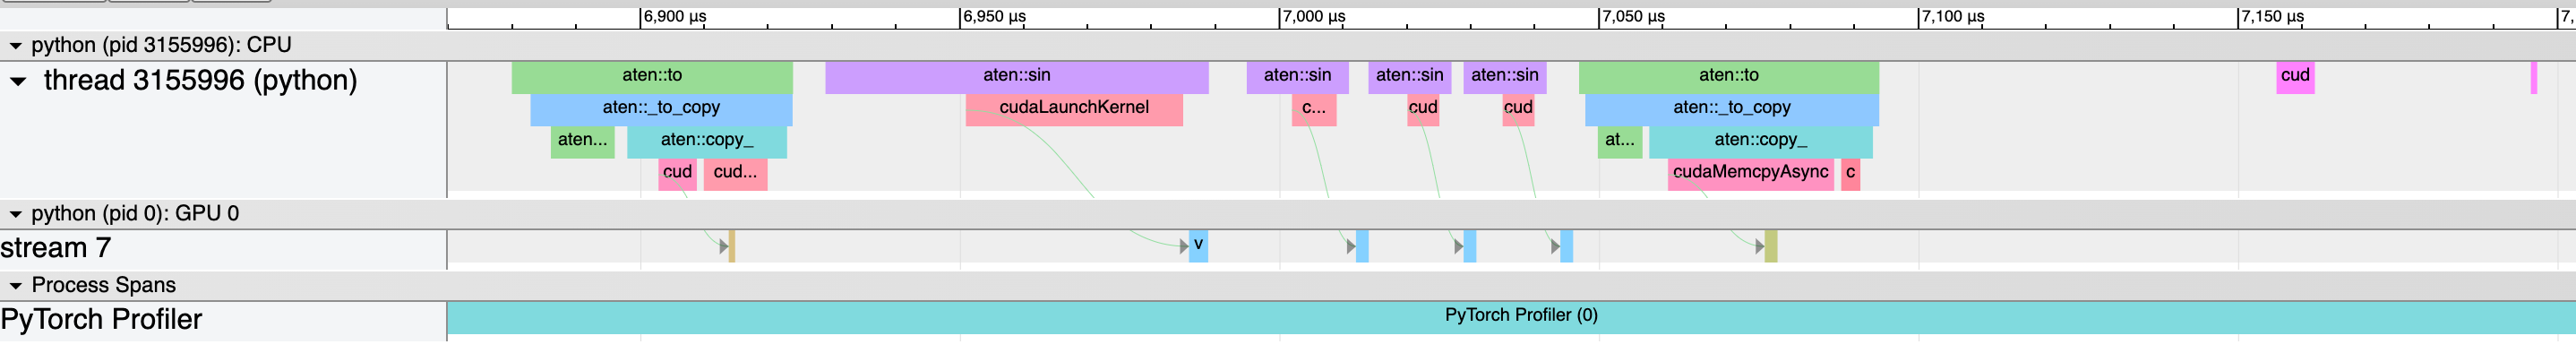
Let’s try to understand the trace:
- The arrows denote the flow of events/execution.
- First, we see the
memcpyfrom CPU to GPU for the input tensor - Next, we see 4 arrows where the kernel for EACH
sinecall is executed - Lastly, we see
memcpyfrom GPU to CPU for the output tensor
- First, we see the
- All these operations happen on
stream 7on the GPU sequentially
Can we do better? Turns out we can employ a couple of techniques:
- Overlapping GPU streams
- Compiled Kernels
Warmup for nested sine
Let’s look at the trace of our nested_sin_gpu for a smaller input tensor (\(2^{10}\) size) and just run the function twice and capture the trace.

- The 2 red box indicate the two back to back run for the same function!
- The first main observation is the long
aten::toslice on the CPU thread for the first run.- This is because for the first time, PyTorch initializes the CUDA context
- This involves setting up various resources and can be a time-consuming operation
- CUDA context initialization happens only once per process for each GPU
- Next is the
aten::sinkernel which is long for the first time but far shorter afterwards- The first time a particular CUDA kernel is used, it needs to be loaded into GPU memory.
- Subsequent calls to the same kernel can use the already-loaded kernel, which significantly reduces execution time.
- PyTorch and CUDA often employ Just-In-Time (JIT) compilation for certain operations.
- The first execution may involve compiling the operation from an intermediate representation into GPU machine code.
- This compiled kernel is cached and reused in subsequent calls, leading to faster execution.
Note: Always warmup your env before profiling or deployment for that matter to ensure a more consistent performance.
Overlap CUDA streams for nested sine
In all our profiling so far, notice how that all the GPU execution happen on the same stream. Our goal now is to see if overlap the following tasks & run them on separate streams, can we get a better performance.
- Upload input tensor to CUDA
- Compute the nested
sine - Download output tensor from CUDA
Let’s update our test function accordingly.
1
2
3
4
5
6
7
8
9
10
11
12
13
14
15
16
17
18
19
20
21
22
23
24
25
26
27
28
29
30
31
32
33
34
35
36
37
from torch.cuda import Stream

# Create CUDA streams for upload, computation, and download
upload_stream = Stream()
compute_stream = Stream()
download_stream = Stream()

def nested_sin_gpu_streams(x: torch.Tensor):

    # Create tensor handles for GPU data
    x_gpu = torch.empty_like(x, device='cuda')

    # Stream 1: Upload data to GPU
    with torch.cuda.stream(upload_stream):
        x_gpu.copy_(x, non_blocking=True)

    # Ensure upload is complete before computation starts
    upload_stream.synchronize()

    # Stream 2: Perform computation
    with torch.cuda.stream(compute_stream):
        y_gpu = torch.sin(x_gpu)
        y_gpu = torch.sin(y_gpu)
        y_gpu = torch.sin(y_gpu)
        y_gpu = torch.sin(y_gpu)

    # Ensure computation is complete before download starts
    compute_stream.synchronize()

    # Stream 3: Download data to CPU
    with torch.cuda.stream(download_stream):
        y = y_gpu.cpu()

    # Ensure download is complete
    download_stream.synchronize()

    return y
Note: Warmup applies to streams as well. Each time you create a stream with
torch.cuda.Streamit needs to be initialized. So if you don’t do a warmup, the kernel might take longer to initialize.
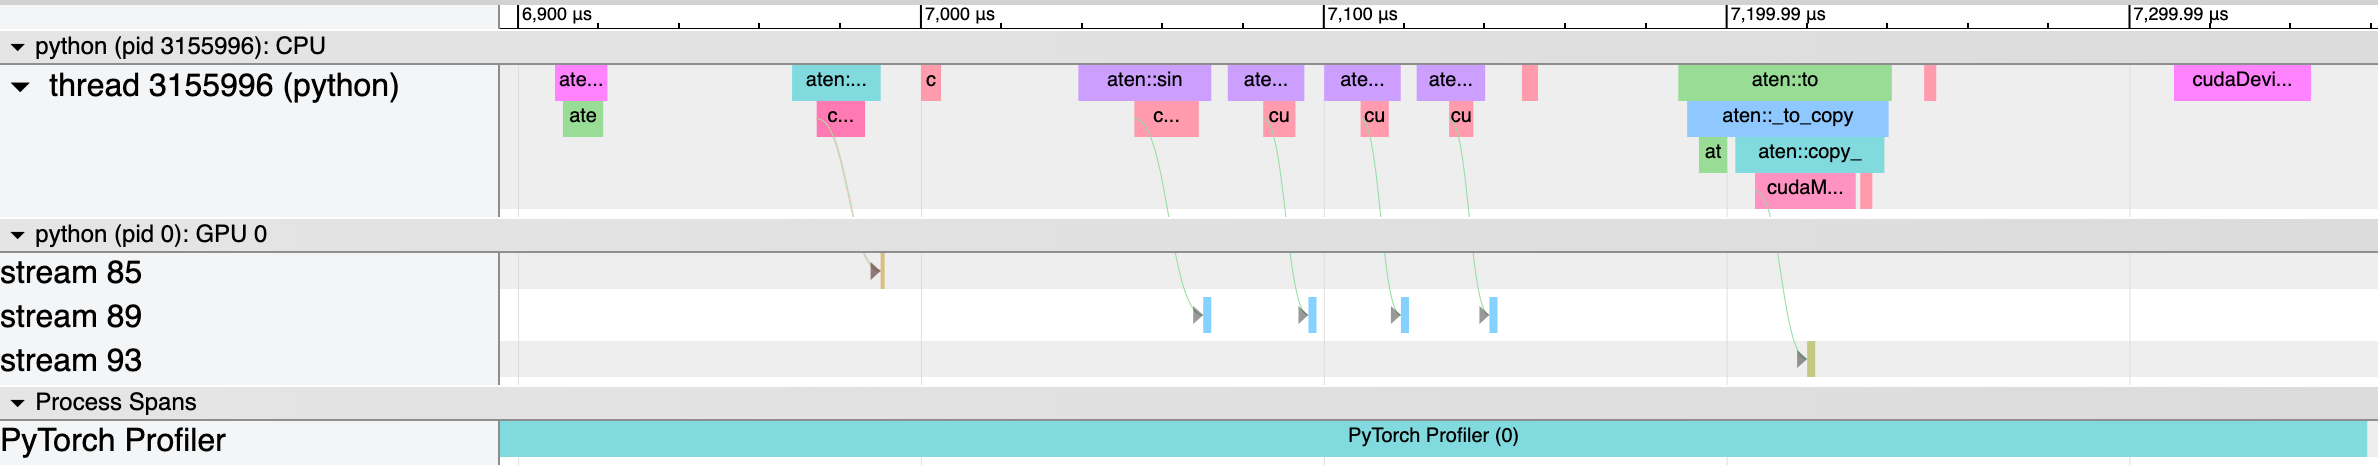
Over here we don’t see much of a benefit, but it can help in cases which are strongly IO heavy though the compiler itself can make such optimizations on the fly.
Compiled kernels with torch.jit.script
Let’s bring our attention to the 4 kernel calls that happen back and forth from CPU & GPU for aten::sin. The GPU is loading and executing the same kernel every time just with different values. What if we can combine the kernels to execute just once on the GPU.
That’s exactly what torch.jit.script does. Let’s modify the code and check how the trace looks now.
1
2
3
4
5
6
7
8
def nested_sin(x: torch.Tensor):
    x = torch.sin(x)
    x = torch.sin(x)
    x = torch.sin(x)
    x = torch.sin(x)
    return x

compiled_nested_sin = torch.jit.script(nested_sin)
Note: As always warmup helps here as well due to previously mentioned reasons but also for the first time you run the compiled function, it’ll execute as is and compile it. Meaning you’ll see the 4 kernel calls for the first run. But after that the function is compiled, and you’ll see only the fused kernel as shown below.
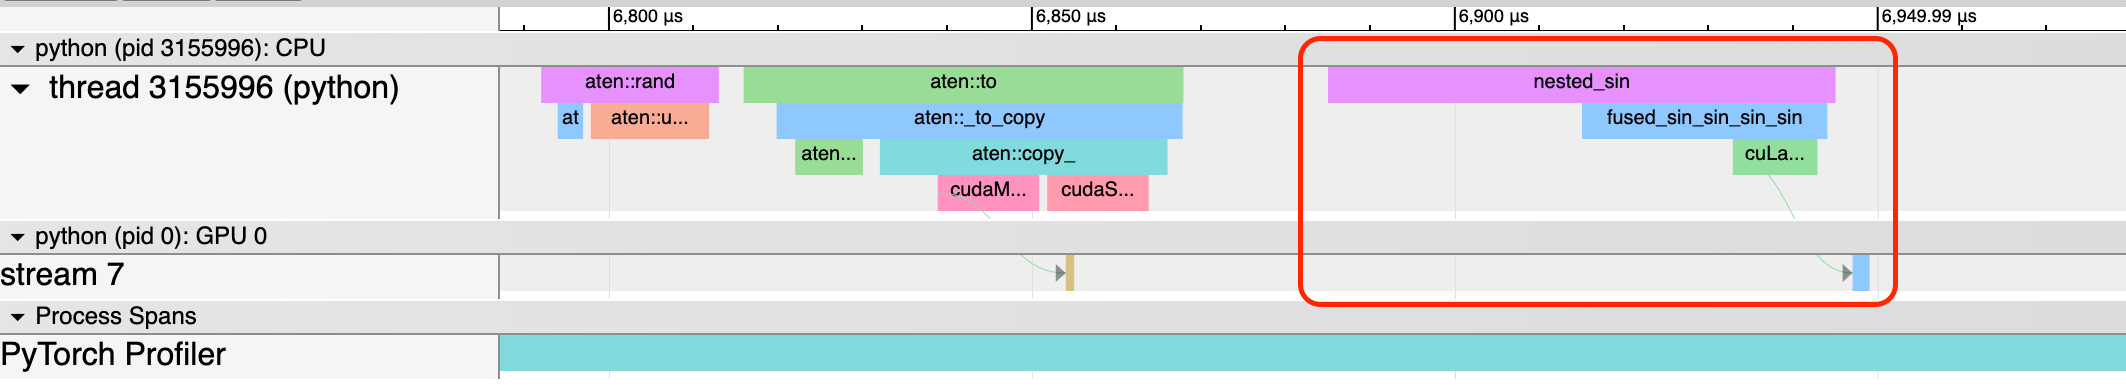
Note: Compiling kernels can be a very powerful tool like in the example where we reduce the
nested_sinexecution time by almost 50% from 100us to 50us approx. But problem is still memory bound so CPU will still be faster here :)